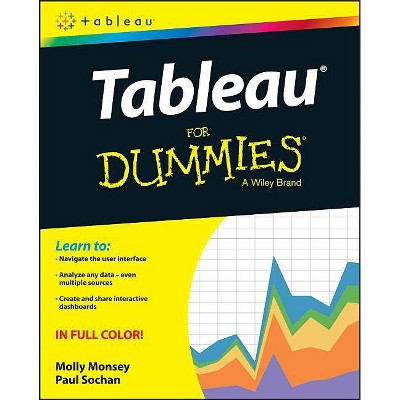
Tableau for Dummies - by Molly Monsey & Paul Sochan (Paperback)
Similar Products
Products of same category from the store
AllProduct info
<p/><br></br><p><b> Book Synopsis </b></p></br></br><b>Make your data work for you!</b> <p><i>Tableau For Dummies</i> brings order to the chaotic world of data. Understanding your data and organizing it into formats and visualizations that make sense to you are crucial to making a real impact on your business with the information that's already at your fingertips. This easy-to-use reference explores the user interface, and guides you through the process of connecting your data sources to the software. Additionally, this approachable, yet comprehensive text shows you how to use graphs, charts, and other images to bring visual interest to your data, how to create dashboards from multiple data sources, and how to export the visualizations that you have developed into multiple formats that translate into positive change for your business. <p>The mission of Tableau Software is to grant you access to data that, when put into action, will help you build your company. Learning to use the data available to you helps you make informed, grounded business decisions that can spell success for your company. <ul> <li>Navigate the user interface to efficiently access the features you need</li> <li>Connect to various spreadsheets, databases, and other data sources to create a multi-dimensional snapshot of your business</li> <li>Develop visualizations with easy to use drag and drop features</li> <li>Start building your data with templates and sample workbooks to spark your creativity and help you organize your information</li> </ul> <p><i>Tableau For Dummies</i> is a step-by-step resource that helps you make sense of the data landscape--and put your data to work in support of your business.<p/><br></br><p><b> From the Back Cover </b></p></br></br><p><b><i>Learn to: </i></b> <ul> <li> Navigate the user interface</li> <li> Analyze any data - even multiple sources</li> <li> Create and share interactive dashboards</li> </ul> <p><b>Learn to organize and communicate your data in exciting new ways!</b> <p>Data analysis is fun and easy with Tableau. This useful guide will let you harness the power of Tableau to perform complex data analysis and create powerful visualizations and dashboards! Learn your way around the software, connect to various data sources, and create analyses, visualizations, and dashboards to share throughout your organization. <ul> <li><b>Meet Tableau</b> -- tour the desktop, learn the tools, see what Tableau can do, and discover how to add dimensions and choose chart types</li> <li><b>Bring on the data</b> -- understand data sources and what you can use, connect to data, keep your data fresh, and start building data views</li> <li><b>Start analyzing</b> -- get a handle on the workspace and what goes where, and explore data display options</li> <li><b>Add a dashboard</b> -- find out how dashboards can aid in visualizing data and make sure yours are easy to use</li> <li><b>Story time</b> -- learn why it's important to tell a story and how to be sure your story serves its purpose</li> <li><b>Get it out there</b> -- publish your analyses and visualizations to Tableau Server or Tableau Online</li> <li><b>A step beyond</b> -- venture into visual analytics and explore Tableau's programming features</li> </ul> <p><b>Open the book and find: </b> <ul> <li> How to rearrange data views</li> <li> All about data connections</li> <li> Ways to choose a data source</li> <li> A guide to shelves and cards</li> <li> Why multiple sheets are useful</li> <li> How to provide online access</li> <li> When to use calculated fields</li> <li> Ten terrific Tableau tips</li> </ul><p/><br></br><p><b> About the Author </b></p></br></br><p><b>Molly Monsey </b>joined Tableau in 2009 as a technical product consultant. She and Paul Sochan work together to lead the Tableau training team. Today she recruits, trains, and supports instructors who educate Tableau users all over the world. <b>Paul Sochan </b>joined Tableau in 2010 and serves as the Senior Director of Global Education Services. The training team he built with Molly Monsey develops all Tableau training offerings. Paul has been in the Business Intelligence space since 1994.
Price History
Cheapest price in the interval: 17.69 on March 10, 2021
Most expensive price in the interval: 17.69 on October 28, 2021
Price Archive shows prices from various stores, lets you see history and find the cheapest. There is no actual sale on the website. For all support, inquiry and suggestion messagescommunication@pricearchive.us


