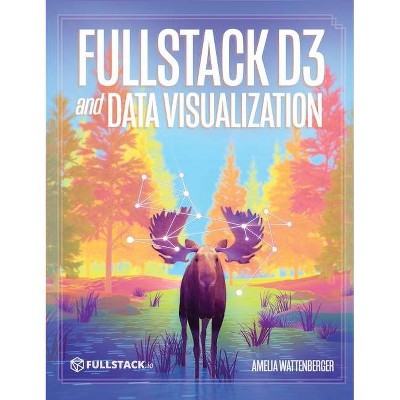
Fullstack D3 and Data Visualization - by Amelia Wattenberger (Hardcover)
Similar Products
Products of same category from the store
AllProduct info
<p/><br></br><p><b> Book Synopsis </b></p></br></br><p>Build beautiful data visualizations with D3</p><p>The Fullstack D3 book is the complete guide to D3. With dozens of code examples showing each step, you can gain new insights into your data by creating visualizations.</p><p>Learn how to quickly turn data into insights with D3</p><p>We have the data. But it needs to be understood by humans. The best way to convert this data into an understandable format is to mold it into a data visualization.</p><p>And <strong>D3 is the best tool for job if you need to create custom data visualizations.</strong></p><p>With <em>Fullstack D3 and Data Visualization</em> you and your team will be able to share key insights, uncover problems before they start, and impress your boss by creating gorgeous visualizations.</p><p>What's Inside</p><p><strong>Chapter 0: Introduction When would you want to use D3.js?</strong></p><p>There is a spectrum of libraries to create charts on the web: on one end, you have easy-to-use, basic libraries that will create a standard chart type.</p><p><strong>Chapter 1: Making your first chart</strong><br /> In this chapter we make a line chart. Line charts are a great starting place because of their popularity, but also because of their simplicity.</p><p><strong>Chapter 2: Making a scatterplot</strong><br /> When looking at the relationship between two metrics, a scatterplot is a good choice. In this chapter we show how to create a scatterplot.</p><p><strong>Chapter 3: Making a bar chart</strong><br /> In this chapter we cover how to create a histogram, which is a bar chart that shows the distribution of one metric, with the metric values on the x axis and the frequency of values on the y axis.</p><p><strong>Chapter 4: Animations and Transitions</strong><br /> When we update our charts, we can animate elements from their old to their new positions. These animations can be visually exciting, but more importantly, they have functional benefits.</p><p><strong>Chapter 5: Interactions</strong><br /> The biggest advantage of creating charts with JavaScript is the ability to respond to user input.</p><p><strong>Chapter 6: Making a map</strong><br /> Maps are also uniquely good at answering geography-based questions. In this chapter, we'll build a map and learn how to plot values within a location.</p><p><strong>Chapter 7: Data Visualization Basics</strong><br /> Now that we're comfortable with how to create a chart, we should zoom out a bit and talk about what chart to create. </p><p><strong>Chapter 8: Common Charts</strong><br /> In this chapter, we talk about common chart types and when to use them. </p><p><strong>Chapter 9: Dashboard Design</strong></p><p>A dashboard is any web interface that makes sense out of dynamic data, and in this chapter we learn how to make one.</p><p><strong>Chapter 10: Advanced Visualization: Marginal Histogram</strong><br /> First, we'll focus on enhancing a chart we've already made: our scatter plot. This chart will have multiple goals, all exploring the daily temperature ranges in our weather dataset.</p><p><strong>Chapter 11: Advanced Visualization: Radial Weather Chart</strong><br /> We talked about radar charts in Chapter 10. For this project, we'll build a more complex radar chart.</p><p><strong>Chapter 12: Advanced Visualization: Animated Sankey Diagram</strong><br /> In this project, we'll be simulating real data and creating an animated diagram to engage our viewers. </p><p><strong>Chapter 13: D3 and React</strong><br /> What's the best way to draw a chart within React? It turns out that there is a fair bit of overlap in functionality between a React and D3 - we'll discuss how we can create blazing fast charts using the two together.</p><p><strong>Chapter 14: D3 and Angular</strong><br /> In this chapter we show how to create optimized SVG charts using D3 and Angular.</p><p/><br></br><p><b> Review Quotes </b></p></br></br><br><p>"I always wondered how I would even start to build something in D3 and now I finally know - this is an awesome book!<br /> Personalizing the data so my charts are my charts.<br /> As a D3 newbie, I couldn't appreciate just how useful this would be. <strong>Amazing</strong>."<br /> - Sergio Sánchez<br /> <em>Founder at Tacosdedatos</em></p><p>"<strong>I loved the chapter on dashboards.</strong> Having built many dashboards over the years, <strong>this is what brought it all together for me.</strong>"</p><p>- Steven Williams<br /> <em>Senior Frontend Engineer at Tallgrass Freight Company</em></p><p>"This book reads really well. Generalizing code is not commonly addressed in D3 books geared towards beginners. Thank you for doing that Amelia! <strong>Great work</strong>!"<br /> - Leandro Collares<br /> <em>Software Developer</em></p><p>"Just did my first scrollytelling experiment using d3.js + javascript for scroll events! <strong>Can't believe it!!</strong>"<br /> - Guillermina Sutter Schneider<br /> <em>Research & Project Manager at Cato Institute</em></p><p>"I really like that this book gets you <strong>creating a MVP chart within 1 chapter</strong>"<br /> - Cameron Yick<br /> <em>Software Engineer, Data Visualization at Datadog</em></p><p>"The course has been amazing so far! It has <strong>a great balance</strong> between educating about dataviz, explaining methodologies, and letting us know which bits are syntactic sugar. Loving the course!"<br /> - Marguerite Roth<br /> <em>Design Lead at Parse.ly</em></p><p>"I was a D3 newbie, but couldn't wait to learn it. Now I understand why people in general say that D3 is quite difficult to learn. Lots of new concepts, but I made it through and I am still having fun! <strong>Amelia is a great teacher.</strong>"<br /> -Ralph Spandl<br /> <em>Information Architect at r42 communication</em></p><br>
Price History
Price Archive shows prices from various stores, lets you see history and find the cheapest. There is no actual sale on the website. For all support, inquiry and suggestion messages communication@pricearchive.us
